


 by Harsh Saini
Imagine you're a seasoned trader, navigating the turbulent waters of the stock market. One day, an unexpected market downturn hits, resulting in significant losses. You find yourself wondering, "Could I have anticipated this?"The answer lies in a powerful financial tool: Value at Risk (VaR). This metric is essential for quantifying and managing financial risks, offering a clear perspective on potential losses.In this comprehensive guide, we’ll delve into the essence of VaR, its significance, and how you can leverage it to sharpen your trading strategies. Understanding and utilizing VaR can transform market uncertainties into strategic insights, ensuring you stay ahead in the trading game. Let’s explore how mastering VaR can elevate your trading approach and provide a competitive edge.
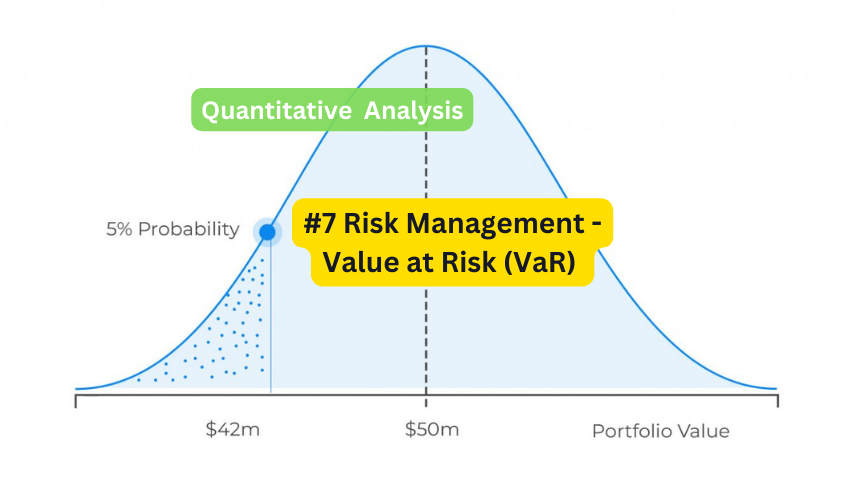
Value at Risk (VaR) is a statistical measure used to assess the risk of loss on a specific portfolio of financial assets. Essentially, VaR quantifies the maximum expected loss over a given time period at a certain confidence level. This means it provides an estimate of how much you could potentially lose in a worst-case scenario.
VaR emerged as a vital tool in the 1990s, particularly after the financial crises that highlighted the need for better risk management. It gained widespread adoption due to its simplicity and effectiveness in providing a clear, quantifiable measure of risk. Today, financial institutions, including StocksPhi, rely on VaR to guide their risk management strategies.
Understanding and managing financial risk is crucial for traders, investors, and financial professionals. Value at Risk (VaR) offers several significant benefits:
VaR helps quantify the potential risk of a portfolio, allowing you to make informed decisions about asset allocation and risk mitigation. By understanding the maximum expected loss, you can take proactive steps to protect your investments.
For traders and investors using StocksPhi services, VaR is an invaluable tool. It provides a clear metric to evaluate the risk-return profile of different investment strategies. This allows for more informed decision-making, whether you're considering a new stock, bond, or derivative.
Regulatory bodies often require financial institutions to use VaR as part of their risk management framework. For example, the Basel III regulations mandate that banks maintain adequate capital reserves based on their VaR estimates. Compliance with these regulations is essential for maintaining financial stability and avoiding penalties.
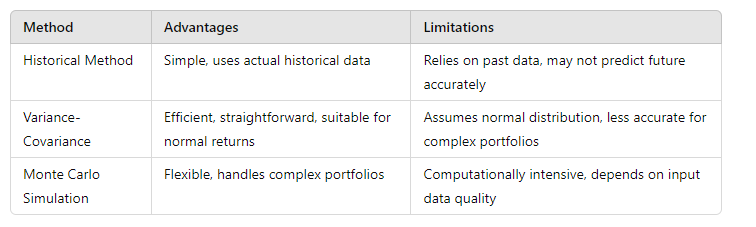
Calculating Value at Risk (VaR) involves several statistical methods, each designed to estimate the potential maximum loss of a portfolio over a specified time period at a given confidence level. The three primary methods are the Historical Method, the Variance-Covariance Method, and Monte Carlo Simulation. Let's delve into each method in detail, examining their procedures, advantages, and limitations.
The Historical Method, also known as the Historical Simulation Method, is a straightforward approach that uses historical market data to estimate future risk. Here's a step-by-step guide to calculating VaR using this method:
Collect Historical Data:
Calculate Returns:
Compute the daily returns for each asset in the portfolio. Returns are calculated as the percentage change in price from one day to the next.

Sort Returns:
Determine VaR:
Advantages:
Limitations:
The Variance-Covariance Method, also known as the Parametric Method, estimates VaR by assuming that asset returns follow a normal distribution. This method uses the mean and standard deviation of returns to calculate risk. Here's how it works:
Calculate Mean and Standard Deviation:

Assume Normal Distribution:
Calculate Portfolio Mean and Variance:
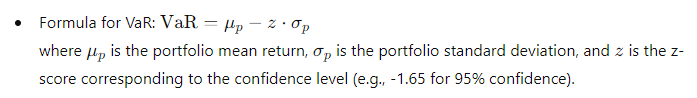
Compute VaR:
Advantages:
Limitations:
Monte Carlo Simulation is a more sophisticated and flexible method that uses random sampling to generate a wide range of possible future outcomes based on the statistical properties of the portfolio's returns. Here’s a detailed process:
Define Parameters:
Generate Random Scenarios:
Calculate Returns for Each Scenario:
Determine VaR:
Advantages:
Limitations:
To illustrate, let's calculate the VaR for a simple portfolio using the Variance-Covariance Method:
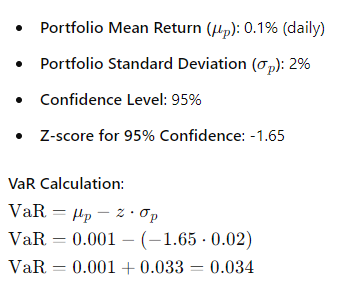
So, the daily VaR at 95% confidence is 3.4%, meaning there is a 95% chance that the portfolio will not lose more than 3.4% of its value in a single day.
Understanding the results of a VaR calculation is crucial for effective risk management.
The confidence level and time horizon significantly impact the VaR estimate. For example, a 95% confidence level over a one-day horizon might show a potential loss of $1,000, while the same confidence level over a ten-day horizon could indicate a higher potential loss.
Comparing VaR results for different assets helps you understand their risk profiles. For instance, a high VaR for a stock indicates higher risk, while a low VaR suggests lower risk. StocksPhi's analytical tools can assist in comparing these metrics across various assets.
Value at Risk (VaR) is versatile and finds applications across various sectors.
Banks use VaR to manage credit, market, and operational risks. VaR helps in determining the capital reserves required to cover potential losses, ensuring financial stability and regulatory compliance.
In investment management, VaR guides portfolio construction and asset allocation. By assessing the risk of different assets, managers can balance risk and return, optimizing portfolio performance.
Corporations use VaR to assess financial risks in their operations. For example, a multinational company might use VaR to evaluate the risk of currency fluctuations on its revenues.
Traders use VaR to manage risk in their trading strategies. By understanding the potential losses, they can implement hedging strategies to protect their positions. StocksPhi's trading platform provides tools to calculate and monitor VaR, enhancing risk management.
Value at Risk (VaR) is an essential tool for quantifying and managing financial risk. Whether you're a trader, investor, or financial professional, understanding VaR can significantly enhance your decision-making and risk management strategies. By leveraging the expertise and tools offered by StocksPhi, you can effectively use VaR to navigate the complexities of the financial markets and protect your investments.