


 by Harsh Saini
In the ever-evolving world of trading, the quest for a reliable and profitable strategy is paramount. With countless technical indicators and methodologies available, it can be challenging to navigate through the noise. This blog post, brought to you by StocksPhi, will delve deep into an advanced trading strategy that integrates multiple technical indicators across various time frames. Our goal is to provide you with a robust framework that enhances your trading accuracy and helps you make informed decisions. With StocksPhi's expertise in trading, we offer not only a detailed breakdown of this strategy but also a comprehensive understanding of the market mechanics behind it.
When we talk about an advanced trading strategy, we're referring to a sophisticated approach that goes beyond basic technical analysis. At StocksPhi, we understand that a successful strategy must be multifaceted, incorporating several indicators to provide a holistic view of market trends. This strategy utilizes six key technical indicators: Relative Strength Index (RSI), Moving Averages, Pivot Points, MACD, Parabolic SAR, and ADX. By analyzing these indicators on both higher and lower time frames, we can filter out false signals and increase the probability of successful trades.
The financial markets are complex and influenced by a myriad of factors. Relying on a single indicator can often lead to misleading signals. For instance, while the RSI might indicate that a stock is oversold, it doesn't necessarily mean the stock will rise. It could remain in oversold territory for an extended period, especially in a strong downtrend. This is where combining multiple indicators, like RSI with MACD or Moving Averages, can provide a more comprehensive picture. Each indicator has its strengths and weaknesses, and by using them together, we can cross-verify signals and reduce the risk of false entries.
A critical component of this advanced trading strategy is multi-time frame analysis. This technique involves analyzing the same asset across different time frames to understand the broader market context. For example, a trader might use a daily chart to identify the overall trend and then switch to an hourly chart to pinpoint entry and exit points. This approach helps traders align their trades with the dominant market trend, thereby increasing the likelihood of success.
Case Study: Imagine a scenario where a trader identifies a bullish trend on the daily chart, with the 50-day EMA above the 200-day EMA. However, on the hourly chart, the RSI is showing oversold conditions, and the MACD is on the verge of a bullish crossover. This alignment of signals across time frames indicates a high-probability trade setup, allowing the trader to enter a position with confidence.
At StocksPhi, we specialize in developing and refining such advanced trading strategies. Our team of experts leverages years of market experience and advanced analytical tools to create strategies that cater to both novice and seasoned traders. Our services include personalized strategy development, backtesting, and real-time market analysis, ensuring that our clients have access to cutting-edge trading methodologies.
Stay tuned as we dive into the specifics of each indicator and how they contribute to this powerful trading strategy. We will cover the calculations, parameters, and interpretation of signals for each indicator, providing you with the tools you need to succeed in the markets. StocksPhi is committed to your trading success, and this blog post is a testament to our dedication to offering valuable trading insights.
In the realm of technical analysis, indicators are tools that traders use to interpret market data and make informed trading decisions. The advanced trading strategy we'll discuss relies on a blend of classic indicators that, when used together, provide a comprehensive market outlook. StocksPhi utilizes these indicators to craft strategies that cater to various trading styles and objectives. Below, we delve into the specific indicators used in this strategy, explaining their calculations, settings, and the unique insights they offer.
The Relative Strength Index (RSI) is a momentum oscillator that measures the speed and change of price movements. It oscillates between 0 and 100, providing signals that are interpreted as overbought or oversold conditions. At StocksPhi, we often use the RSI to identify potential reversal points in the market.
Calculation: The RSI is calculated using the following formula:
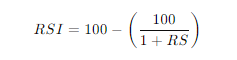
where RSRS RS (Relative Strength) is the average of the up closes divided by the average of the down closes over a specific period. This period is typically set to 14 days, although it can be adjusted based on the trader's preference.
Moving Averages are widely used in technical analysis to smooth out price data, making it easier to identify the direction of the trend. StocksPhi incorporates both Simple Moving Averages (SMA) and Exponential Moving Averages (EMA) in our advanced trading strategies.
Exponential Moving Average (EMA): The EMA gives more weight to recent prices, making it more responsive to new information. The formula for EMA is:
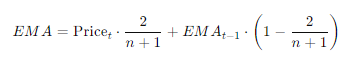
where nn n is the number of periods.
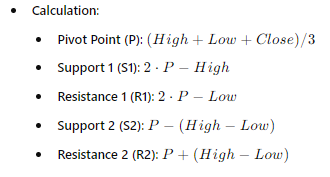
Pivot Points are a type of technical analysis indicator used to determine overall market trends over different time frames. StocksPhi uses pivot points to identify potential support and resistance levels, which are crucial for setting entry and exit points.
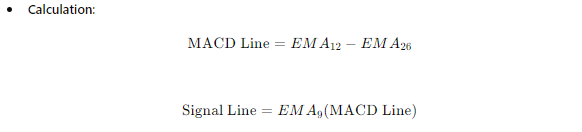
The Moving Average Convergence Divergence (MACD) is a trend-following momentum indicator that shows the relationship between two moving averages of a security’s price. It consists of the MACD line, Signal line, and Histogram.
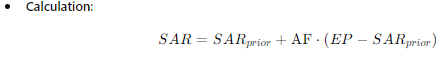
The Parabolic SAR is a trend-following indicator that provides potential reversal points in the market. It is plotted as a series of dots above or below the price, indicating the potential stop-loss levels.
The Average Directional Index (ADX) is used to quantify the strength of a trend, regardless of its direction. A higher ADX value indicates a stronger trend, while a lower value indicates a weaker trend.
Calculation:
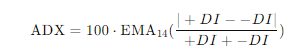
where:
Crafting an advanced trading strategy involves more than just understanding individual indicators; it requires a systematic approach to combining them to generate reliable signals. At StocksPhi, we emphasize the importance of not only identifying potential entry and exit points but also ensuring that these signals are accurate and timely. This section will outline the specific rules and logic for entering and exiting trades, utilizing a combination of the previously discussed indicators. We will also delve into the importance of multi-time frame analysis in enhancing the strategy's robustness.
Identifying the right moment to enter a trade is crucial for maximizing profit potential and minimizing risk. The following criteria outline a comprehensive approach to pinpointing optimal entry points using our set of technical indicators:
Example: Suppose a stock's RSI is at 25 and rising, the 9-day EMA crosses above the 21-day EMA, the MACD shows a bullish crossover, and the ADX is at 22 and increasing. The price has also bounced off the S1 level and is above the Pivot Point. This alignment of signals suggests a high-probability bullish entry.
Example: Consider a scenario where a stock's RSI is at 75 and declining, the 9-day EMA crosses below the 21-day EMA, the MACD shows a bearish crossover, and the ADX is at 25 and increasing. The price also rejects the R1 level and is below the Pivot Point. This set of signals suggests a high-probability bearish entry.
Equally important as entry criteria are the exit rules, which help traders lock in profits and minimize losses. The following are key exit signals for the strategy:
Example: Suppose a trader enters a long position based on the criteria above. As the price approaches the R2 level, the RSI reaches 80 and starts to fall, the MACD shows a bearish crossover, and the Parabolic SAR flips above the price. These signals indicate it's time to exit the position and secure profits.
Example: If a trader shorted a stock based on the bearish entry criteria and the price reaches S2, with the RSI at 25 and rising, the MACD shows a bullish crossover, and the Parabolic SAR flips below the price, it signals that it's time to exit the short position.
A cornerstone of this advanced trading strategy is multi-time frame analysis. This technique involves assessing multiple time frames to gain a more nuanced understanding of market conditions. At StocksPhi, we utilize this approach to align our trades with the dominant market trend while fine-tuning entries and exits.
Implementation: A trader might first identify a bullish trend on the daily chart, with the 50-day EMA above the 200-day EMA. They would then look for a pullback to a support level on the 4-hour chart, confirmed by a rising RSI or a bullish MACD crossover. Finally, they would enter the trade on a lower time frame, such as the 15-minute chart, ensuring they capture the optimal entry point.
Case Study: Consider a situation where a stock shows a strong uptrend on the daily chart, confirmed by all indicators. However, on the 4-hour chart, the price retraces to the 50-day EMA, and the RSI moves into oversold territory. On the 15-minute chart, the RSI rises from oversold, and the MACD shows a bullish crossover. This multi-time frame alignment provides a high-confidence entry signal.
In any advanced trading strategy, effective risk management and continuous optimization are crucial for long-term success. While technical indicators and multi-time frame analysis provide the tools for identifying high-probability trades, managing risk ensures that losses are contained and profits are maximized. At StocksPhi, we emphasize these aspects to help traders maintain discipline and improve their trading performance over time.
Effective risk management involves a combination of strategies and rules designed to protect a trader's capital. The following principles are essential components of our strategy:
Position sizing refers to determining the amount of capital allocated to a single trade. It is a key aspect of risk management that helps control potential losses.
Calculation:
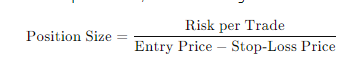
Example: Suppose a trader wants to enter a long position in a stock priced at $50, with a stop-loss set at $48. If they risk 1% of their $10,000 capital, the maximum loss is $100. The position size would be:
![]()
Setting stop-loss and take-profit levels is crucial for managing risk and locking in profits.
Example: In a long position, if a trader enters at $50 and sets a stop-loss at $48, they may set a take-profit level at $55, aiming for a risk-reward ratio of 1:2.
The risk-reward ratio is a key metric in trading that compares the potential loss to the potential gain of a trade.
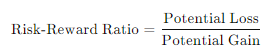
Ideal Ratios: Traders should aim for a risk-reward ratio of at least 1:2. This means that for every $1 risked, the potential reward should be at least $2.
Example: If a trader risks $2 per share with a stop-loss at $48 and a target profit of $5 per share (take-profit at $55), the risk-reward ratio is 1:2.5.
Optimizing a trading strategy involves continuous evaluation and adjustment to improve performance. StocksPhi employs various methods to optimize strategies, ensuring they remain effective in changing market conditions.
Backtesting involves applying a trading strategy to historical data to evaluate its performance. This process helps identify potential issues and validate the effectiveness of the strategy before using real capital.
Case Study: A trader using the StocksPhi strategy might backtest the RSI, MACD, and Moving Averages combination over the past five years. They would look at the number of trades, the win rate, and the total profit or loss to gauge the strategy's effectiveness.
Forward testing, or paper trading, involves applying the strategy in real-time without risking actual capital. This allows traders to see how the strategy performs in current market conditions.
Example: After backtesting, a trader might paper trade the strategy for three months, keeping detailed records of trades, observations, and any adjustments made.
Regularly reviewing strategy performance and making necessary adjustments is crucial for long-term success.
Example: If a trader notices that the strategy's performance deteriorates during periods of high volatility, they may adjust the stop-loss levels to account for wider price swings or incorporate additional indicators that better capture market conditions.
StocksPhi offers a range of services designed to help traders implement and optimize their strategies effectively. Our expertise in technical analysis, risk management, and market dynamics allows traders to leverage advanced tools and resources. Whether you're looking to backtest a new strategy, receive personalized trading advice, or access cutting-edge market research, StocksPhi provides the support you need to excel in trading.
In the ever-changing world of financial markets, staying ahead requires more than just a robust advanced trading strategy. Continuous monitoring and adaptation are vital for maintaining and improving the effectiveness of your trading approach. StocksPhi emphasizes the importance of being proactive and responsive to market conditions, ensuring that strategies remain relevant and profitable.
Monitoring your trades and market conditions in real time is crucial for timely decision-making and risk management. Here's why:
Example: Suppose a trader has a long position in a stock based on bullish signals. By monitoring real-time data, they notice an unexpected news release causing a sharp decline in the stock price. This immediate observation enables them to exit the position promptly, minimizing losses.
Case Study: During an earnings season, a trader using the StocksPhi strategy may pay close attention to earnings reports and guidance from key companies. A positive surprise could present a bullish trading opportunity, while negative news might suggest caution or a potential short setup.
Markets are dynamic, and strategies must adapt to remain effective. Here's how traders can adjust their strategies in response to changing market conditions:
Example: During a market correction, volatility tends to increase. A trader may choose to widen their stop-loss levels and reduce position sizes to protect against sharp price swings.
Case Study: A trader might observe that technology stocks tend to perform well in the first quarter due to year-end earnings reports and new product launches. They could adjust their strategy to capitalize on this seasonal trend.
StocksPhi offers a suite of services designed to support traders in monitoring and adapting their strategies. Our platform provides real-time data, market analysis, and expert insights, ensuring you stay informed and ready to act. Here's how StocksPhi can assist:
In this comprehensive guide, we've explored the intricacies of developing and implementing an advanced trading strategy using a combination of technical indicators, multi-time frame analysis, and robust risk management. The journey from understanding individual indicators to integrating them into a cohesive trading plan highlights the importance of a structured and disciplined approach.
StocksPhi stands as a reliable partner in this journey, offering unparalleled expertise and resources to help traders succeed. Our commitment to providing advanced tools, continuous education, and market insights ensures that traders are well-equipped to navigate the complexities of the financial markets.
By embracing the principles and techniques outlined in this guide, traders can enhance their decision-making, manage risks effectively, and ultimately achieve consistent profitability. Whether you're a seasoned trader or just starting, StocksPhi is here to support your trading endeavors and help you thrive in the dynamic world of trading.