


 by Harsh Saini
Imagine you're a trader who has struggled to find the right entry and exit points in the market. You constantly see your trades getting stopped out or missing the big moves. Then, you discover swing point analysis. This revelation transforms your trading strategy, providing clarity and precision in your decision-making process. StocksPhi specializes in helping traders like you understand and leverage market structure through swing point analysis, enhancing your trading performance significantly.
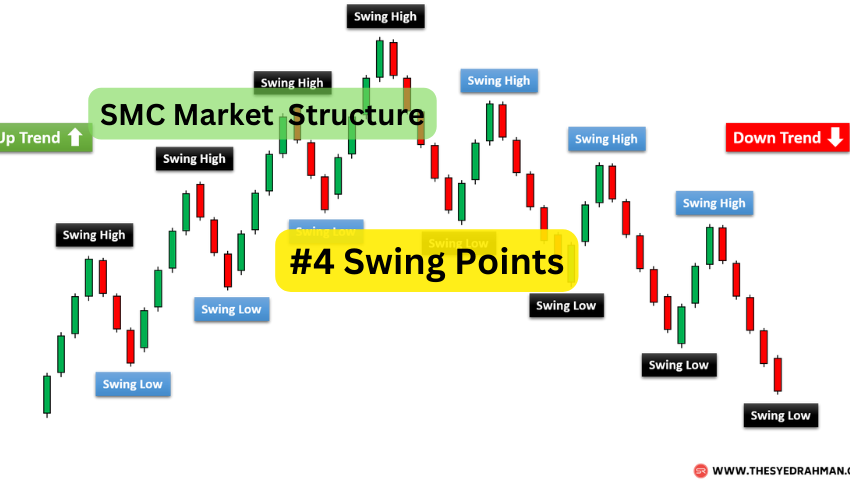
Swing points are critical elements in understanding market structure. They represent the turning points in price action, marking the highs and lows that form the foundation of trend analysis. Swing highs are peaks where the price direction changes from upward to downward, while swing lows are troughs where the direction shifts from downward to upward. Recognizing these points is crucial for identifying trends and making informed trading decisions.
Visualizing these points can be immensely helpful. The diagram below illustrates swing highs and swing lows in a typical price chart:
Swing points play a pivotal role in market structure, acting as indicators of potential trend reversals or continuations. StocksPhi uses advanced tools and techniques to help traders pinpoint these swing points accurately, making trading decisions more precise and profitable.
Understanding swing points is essential for several reasons:
Identifying Trends: Swing points help in spotting the start and end of trends. By connecting consecutive swing highs and swing lows, traders can determine the market's direction.
Example: If the price consistently forms higher swing highs and higher swing lows, it indicates an uptrend.
Determining Entry and Exit Points: Swing points provide clear signals for entering and exiting trades. Traders often place buy orders near swing lows and sell orders near swing highs.
StocksPhi offers expert guidance on using swing points to optimize entry and exit points, ensuring you maximize your trading potential.
Support and Resistance Levels: Swing points often coincide with key support and resistance levels. A swing high can act as a resistance level, while a swing low can act as a support level.
Swing points can be identified through various methods, including chart analysis, indicators, and manual identification:
Several tools can assist in identifying swing points:
StocksPhi integrates these tools into their platform, providing traders with real-time swing point analysis and enhancing their trading strategies.
Manually identifying swing points involves observing price charts across different timeframes. Look for significant peaks and troughs that mark potential reversals. StocksPhi offers educational resources and tutorials to help traders master manual identification of swing points.
Swing points behave differently in various market phases. Understanding these behaviors is crucial for accurate analysis:
Uptrend: In an uptrend, swing points are characterized by higher highs and higher lows.
Example: During an uptrend, traders look for swing lows to place buy orders.
Downtrend: In a downtrend, swing points are marked by lower highs and lower lows.
Example: In a downtrend, traders look for swing highs to place sell orders.
Sideways/Range-Bound Market: In a range-bound market, swing points form horizontal support and resistance levels.
Example: Traders identify the range's upper and lower boundaries for placing trades.
StocksPhi provides tools to analyze swing points in all market phases, helping traders adapt their strategies to changing market conditions.
Swing points can be integrated into various trading strategies to enhance their effectiveness:
Swing trading involves capturing short-to-medium-term gains by trading between swing points. Traders aim to buy at swing lows and sell at swing highs. StocksPhi offers advanced analytics to identify optimal swing points for executing trades.
In a breakout strategy, traders use swing points to identify potential breakouts from consolidation patterns. A breakout above a swing high indicates a bullish move, while a breakout below a swing low signals a bearish move.
A reversal strategy focuses on identifying potential trend reversals using swing points. When the price breaks a significant swing point, it often signals a reversal in the current trend. StocksPhi provides real-time alerts to help traders capitalize on these opportunities.
Integrating swing points with other technical indicators can enhance accuracy. For instance, combining swing points with RSI (Relative Strength Index) or MACD (Moving Average Convergence Divergence) can confirm potential trades.
Even experienced traders can make mistakes when using swing points. Here are some common pitfalls and how to avoid them:
StocksPhi provides comprehensive training to help traders avoid these common mistakes, ensuring they use swing point analysis effectively.
Several tools and resources can aid in swing point analysis:
Q1: What is the best timeframe for identifying swing points?
A1: The ideal timeframe depends on your trading style. Swing traders often use daily or hourly charts, while day traders may prefer shorter timeframes.
Q2: Can swing points be used in all markets?
A2: Yes, swing points can be applied to all financial markets, including stocks, forex, commodities, and cryptocurrencies.
Q3: How reliable are swing points in volatile markets?
A3: Swing points can still be effective in volatile markets, but traders should be cautious and consider additional factors such as market sentiment and news events.
Q4: What are the limitations of using swing points?
A4: Swing points are not foolproof and can produce false signals. It's essential to combine swing point analysis with other technical tools and indicators.
Understanding and utilizing swing point analysis can significantly enhance your trading strategy. By identifying key turning points in the market, you can make more informed decisions, optimize entry and exit points, and improve overall trading performance. StocksPhi provides the expertise, tools, and resources to help you master swing point analysis, ensuring you stay ahead in the competitive world of trading.
Feel free to join StocksPhi for more in-depth analysis, real-time tools, and expert guidance on swing point analysis and other trading strategies. Enhance your trading journey with the precision and clarity that StocksPhi offers.