


 by Harsh Saini
Introduction: Welcome to Stocksphi, your go-to resource for mastering the art and science of stock selection. In this comprehensive guide, we'll delve into the intricacies of picking stocks intelligently, leveraging cutting-edge strategies, behavioral insights, and advanced technologies. Whether you're a seasoned investor, a curious learner, or a professional in the finance industry, this guide is designed to equip you with the knowledge and tools needed to excel in the dynamic world of stock markets.
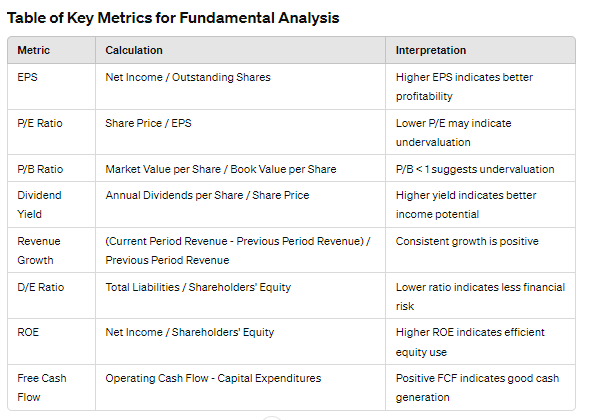
Fundamental analysis involves evaluating a company's financial health, management, industry position, and market conditions to determine its intrinsic value. This method helps investors make informed decisions based on the company’s underlying performance rather than market speculation. Let's delve into the critical components of fundamental analysis.
Earnings per Share (EPS) is a crucial indicator of a company's profitability. It is calculated by dividing the net income by the number of outstanding shares. EPS provides insight into the company's profit allocation to each share, making it easier to compare profitability across different companies.
Example: Suppose a company has a net income of $1 million and 1 million outstanding shares. The EPS would be: EPS=Net IncomeOutstanding Shares=1,000,0001,000,000=1
![]()
A higher EPS generally indicates better profitability, which can make the stock more attractive to investors.
The Price-to-Earnings Ratio (P/E) compares a company's current share price to its per-share earnings. It's a vital tool for assessing whether a stock is overvalued or undervalued compared to its earnings.
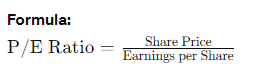
Types:
A lower P/E ratio might indicate that the stock is undervalued, whereas a higher P/E suggests it might be overvalued relative to its earnings. However, P/E ratios should be compared within the same industry for accurate insights.
The Price-to-Book Ratio (P/B) measures a company’s market value relative to its book value. The book value represents the company's net asset value (total assets minus total liabilitie.
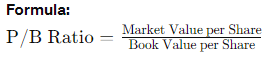
A P/B ratio less than 1 might indicate that the stock is undervalued, while a ratio above 1 could suggest it is overvalued. Investors use this metric to find potential investment opportunities, especially in industries with significant physical assets.
Dividend Yield is the ratio of a company's annual dividend compared to its share price. It's essential for income-focused investors seeking regular returns.
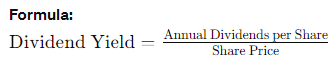
For example, if a company pays an annual dividend of $2 and its share price is $50, the dividend yield would be:
![]()
A higher dividend yield can be attractive, but it’s crucial to assess the sustainability of the dividends.
Revenue is the total income generated from sales, while Revenue Growth indicates how well a company can increase its sales over time.
Metrics to Watch:
Consistent revenue growth often signals a company's ability to expand its market share and profitability.
The Debt-to-Equity Ratio (D/E) compares a company’s total liabilities to its shareholders' equity. It’s a measure of financial leverage and indicates how much debt the company is using to finance its operations.

A high D/E ratio might indicate higher risk, especially if earnings are volatile, whereas a lower ratio suggests a more conservative approach to financing.
Return on Equity (ROE) measures a company's profitability by revealing how much profit a company generates with the money shareholders have invested.
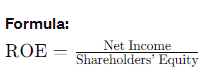
Higher ROE values typically indicate efficient use of equity capital.
Free Cash Flow (FCF) is the cash a company generates after accounting for capital expenditures. It indicates the company’s ability to generate cash and fund its operations, pay dividends, and pursue growth opportunities.
Formula: FCF=Operating Cash Flow−Capital Expenditures
FCF Margin (FCF/Revenue) shows the proportion of revenue that turns into free cash flow, highlighting efficiency in cash management.
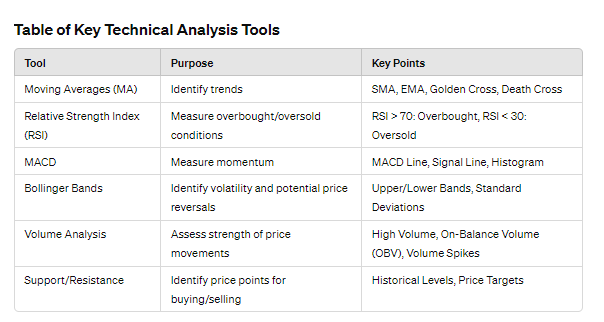
While fundamental analysis focuses on a company's intrinsic value, technical analysis looks at historical price and volume data to predict future stock price movements. Traders and investors at Stocksphi rely on technical analysis to time their trades more effectively, ensuring they maximize profits and minimize losses.
Moving Averages (MA) smooth out price data to identify trends over a specific period. They help traders see past the noise of daily price fluctuations.
Types of Moving Averages:
Crossovers:
The Relative Strength Index (RSI) measures the speed and change of price movements. It oscillates between 0 and 100 and is used to identify overbought or oversold conditions.
Example: If a stock has an RSI of 80, it is considered overbought, and a correction might be imminent. Conversely, an RSI of 25 suggests the stock is oversold and may experience upward pressure.
Moving Average Convergence Divergence (MACD) is a momentum indicator that shows the relationship between two moving averages of a stock’s price.
Components:
Interpretation:
Bollinger Bands consist of a middle band (a 20-day SMA) and two outer bands that are two standard deviations away from the middle band. They help traders identify volatility and potential overbought or oversold conditions.
Use Cases:
Volume analysis is crucial in understanding the strength of a price movement. High volume during a price increase suggests strong buying interest, whereas high volume during a price decrease indicates strong selling pressure.
Indicators:
Support and resistance levels are critical in technical analysis. Support is a price level where a stock tends to find buying interest, while resistance is where selling interest appears.
How to Identify:
These levels help traders make buy or sell decisions, set stop-loss orders, and determine price targets.
Case Study: Let's look at the stock of ABC Corp. The stock price recently crossed the 50-day SMA (a golden cross), and the RSI is at 75, indicating it’s overbought. The MACD histogram shows positive momentum, but volume has started to decline. The stock is nearing a resistance level at $100, where it has faced selling pressure before.
Interpretation: While the golden cross and MACD suggest bullish momentum, the high RSI and approaching resistance level indicate caution. If volume continues to decline, a pullback might occur soon.
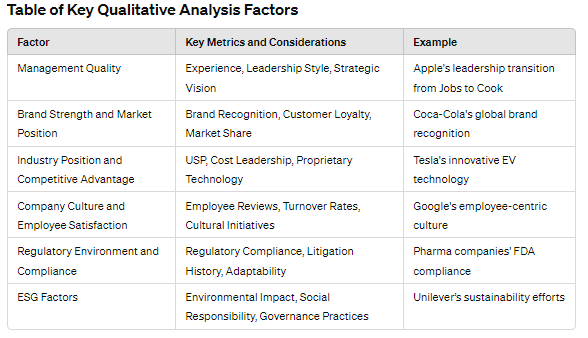
While fundamental and technical analyses are vital, qualitative analysis delves into the intangible aspects of a company. This approach examines elements like management quality, brand strength, and industry position, which are crucial for making well-rounded investment decisions. At Stocksphi, we emphasize qualitative analysis to complement quantitative methods, ensuring a holistic view of potential stock picks.
The effectiveness and vision of a company's management team can significantly impact its success. Assessing management quality involves looking at the leadership’s track record, strategic decisions, and ability to navigate challenges.
Key Factors:
Example: Consider Apple's leadership transition from Steve Jobs to Tim Cook. Cook's operational expertise and strategic decisions have maintained Apple's market dominance and innovation drive, showcasing the impact of effective management.
A strong brand can provide a competitive edge, allowing a company to command premium pricing and foster customer loyalty. Analyzing brand strength involves understanding the company’s reputation, customer base, and market position.
Key Metrics:
Case Study: Coca-Cola's brand strength is evident in its global recognition and dominant market share. Despite numerous competitors, its strong brand equity allows it to sustain high profit margins and customer loyalty.
Understanding a company's position within its industry and its competitive advantages can provide insights into its long-term viability. Competitive advantages can include unique products, cost leadership, and proprietary technologies.
Factors to Consider:
Example: Tesla's competitive advantage lies in its innovative electric vehicle technology and advanced battery systems, which position it as a leader in the EV market despite increasing competition.
A positive company culture and high employee satisfaction can lead to better performance and innovation. Companies that value their employees often see lower turnover rates and higher productivity.
Assessment Methods:
Example: Google is renowned for its employee-centric culture, offering numerous perks and a collaborative environment, which has helped it attract top talent and foster innovation.
The regulatory landscape can significantly impact a company's operations and profitability. Understanding how well a company adheres to regulations and its ability to navigate regulatory changes is crucial.
Key Considerations:
Example: Pharmaceutical companies must navigate stringent FDA regulations. A company's ability to maintain compliance and successfully bring new drugs to market can be a strong indicator of its operational robustness.
ESG factors are increasingly important to investors looking to make socially responsible investment decisions. Evaluating a company's ESG performance can provide insights into its long-term sustainability and ethical practices.
Components:
Example: Unilever’s commitment to sustainability and social responsibility has enhanced its brand reputation and attracted socially conscious investors, highlighting the importance of strong ESG practices.
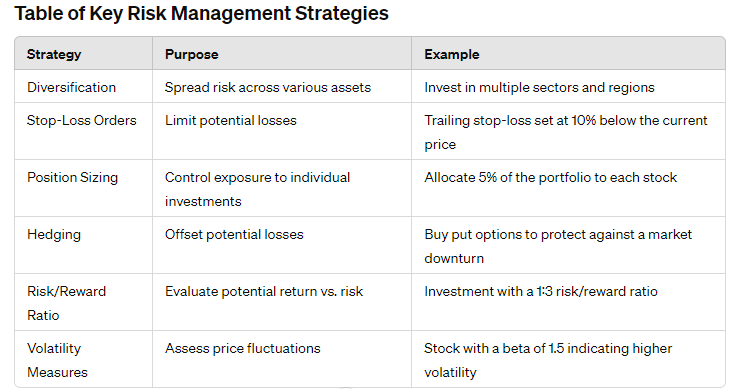
Effective risk management is crucial for successful stock selection. At Stocksphi, we emphasize comprehensive risk management strategies to protect our clients' investments and optimize their returns. Understanding and mitigating risks can help traders and investors avoid significant losses and make more confident decisions.
Diversification is the practice of spreading investments across various assets to reduce exposure to any single asset or risk. A diversified portfolio can mitigate the impact of poor performance from individual stocks.
Key Strategies:
Example: A portfolio consisting of technology, healthcare, and consumer goods stocks from various global markets is less likely to experience significant losses from a downturn in any single sector or region.
A stop-loss order is a predetermined price at which an investor will sell a stock to limit losses. Setting stop-loss orders can help traders manage risks by automatically selling a stock when its price falls to a certain level.
Types of Stop-Loss Orders:
Example: If you buy a stock at $50 and set a trailing stop-loss at 10%, the stop-loss will move up as the stock price increases. If the stock reaches $60, the stop-loss will be set at $54, protecting profits while limiting potential losses.
Position sizing involves determining the amount of money to invest in a particular stock, based on the overall portfolio size and risk tolerance. Proper position sizing helps manage risk by limiting the exposure to any single investment.
Methods:
Example: If you have a $100,000 portfolio and decide to allocate 5% to each stock, you would invest $5,000 in each stock. Adjusting position sizes based on risk ensures that no single stock can disproportionately impact the portfolio.
Hedging involves using financial instruments to offset potential losses in an investment. Common hedging strategies include options, futures, and inverse ETFs.
Hedging Tools:
Example: If you own a large position in a tech stock and are concerned about a market downturn, you can buy put options on the stock. If the stock price drops, the value of the put options will increase, offsetting the losses.
The risk/reward ratio compares the potential risk of an investment to its potential reward. A favorable risk/reward ratio helps investors make informed decisions by evaluating whether the potential return justifies the risk.
Calculation:
![]()
Example: If an investment has a potential loss of $100 and a potential gain of $300, the risk/reward ratio is 1:3. This indicates that the potential reward is three times the potential risk, making it an attractive investment.
Volatility measures the extent to which a stock's price fluctuates. Higher volatility indicates higher risk. Understanding and managing volatility can help investors make more informed decisions.
Volatility Indicators:
Example: A stock with a beta of 1.5 is 50% more volatile than the market. If the market rises or falls by 10%, the stock is expected to rise or fall by 15%. Understanding this helps investors gauge the risk associated with the stock.
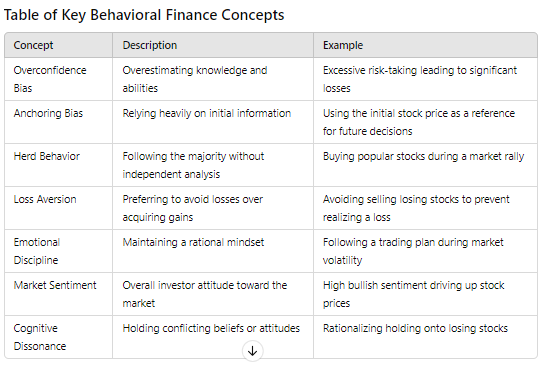
Behavioral finance examines how psychological influences and biases affect investors' decisions and market outcomes. Understanding these factors can help traders and investors make more rational choices, avoiding common pitfalls driven by emotions and cognitive errors. At Stocksphi, we emphasize the importance of behavioral finance in stock selection and investment strategies, leveraging our expertise to guide clients toward more disciplined and objective decision-making.
Several biases can impact investment decisions, leading to suboptimal outcomes. Recognizing and mitigating these biases is crucial for successful stock selection.
Key Biases:
Example: An investor influenced by herd behavior might buy a popular stock during a market rally without conducting proper research. When the market corrects, the investor may face significant losses.
Maintaining emotional discipline is essential for making rational investment decisions. Emotions like fear and greed can lead to impulsive actions that harm portfolio performance.
Strategies for Emotional Discipline:
Example: During a market downturn, a disciplined investor with a clear trading plan is less likely to panic and sell at a loss. Instead, they might see the downturn as a buying opportunity for undervalued stocks.
Market sentiment refers to the overall attitude of investors toward a particular security or the market as a whole. Positive sentiment can drive prices up, while negative sentiment can lead to declines.
Indicators of Market Sentiment:
Example: During periods of high bullish sentiment, stock prices may rise due to increased buying pressure. Conversely, high bearish sentiment can lead to sell-offs and declining prices.
Cognitive dissonance occurs when investors hold conflicting beliefs or attitudes, leading to discomfort and rationalization of poor decisions. This can result in holding onto losing stocks to avoid acknowledging a mistake.
Mitigation Strategies:
Example: An investor may hold onto a losing stock due to cognitive dissonance, rationalizing that the price will eventually rebound. By seeking diverse opinions and staying objective, the investor can recognize when it’s time to cut losses and reallocate funds.
Leveraging tools and resources can help investors manage behavioral biases and make more informed decisions. Stocksphi offers various tools and educational resources to support our clients in this area.
Stocksphi Behavioral Finance Tools:
Example: Using sentiment analysis, Stocksphi clients can gain insights into prevailing market attitudes and adjust their strategies accordingly. Bias detection tools help investors recognize and overcome personal biases, leading to more rational decision-making.
In conclusion, stock selection is a multifaceted process that requires a combination of strategic analysis, risk management, and behavioral discipline. At Stocksphi, we specialize in empowering traders, investors, learners, technologists, and professionals with the knowledge, tools, and resources they need to navigate the complex world of stock markets effectively.
Throughout this comprehensive guide, we've explored key concepts and strategies essential for successful stock selection:
Fundamental Analysis: Understanding a company's financial health, performance, and industry dynamics is crucial for making informed investment decisions.
Technical Analysis: Utilizing charts, patterns, and indicators helps identify market trends, entry/exit points, and potential opportunities.
Risk Management: Implementing risk mitigation strategies, diversification, and setting stop-loss orders are vital for protecting investments.
Behavioral Finance: Recognizing and managing behavioral biases, maintaining emotional discipline, and staying objective are essential for rational decision-making.
Stocksphi's expertise in these areas, coupled with our commitment to continuous learning, innovation, and client-centric services, positions us as a trusted partner in the journey toward financial success. We provide personalized guidance, actionable insights, and cutting-edge tools to help our clients achieve their investment goals and navigate the ever-evolving financial landscape with confidence.
In summary, effective stock selection involves a blend of art and science, combining thorough analysis, disciplined strategies, and leveraging technological advancements. With Stocksphi's comprehensive approach and dedication to empowering our clients, we aim to drive success and prosperity in the world of stock markets.
For personalized guidance, expert advice, and access to advanced tools, join Stocksphi today and embark on a journey of informed and strategic investing.