


 by Harsh Saini
Introduction
Welcome to Stocksphi's comprehensive guide on regression analysis in trading. In this article, we will delve into the depths of regression analysis, focusing on both linear and multiple regression, and their assumptions. Understanding regression analysis is crucial for traders and investors to make informed decisions in the dynamic world of financial markets.
Regression analysis is a powerful statistical technique used to understand the relationship between one dependent variable and one or more independent variables. By analyzing historical data, regression analysis helps predict future outcomes and identify patterns that can inform trading strategies.
At Stocksphi, we are committed to empowering traders with the knowledge and tools they need to succeed in the financial markets. Our expertise in regression analysis allows us to provide cutting-edge solutions that enhance trading performance and decision-making processes.
Now, let's dive into the world of regression analysis and uncover its significance in trading.
What is Regression Analysis?
Regression analysis is a statistical method used to examine the relationship between one dependent variable and one or more independent variables. It helps in understanding how the value of the dependent variable changes when one or more independent variables are varied. This analysis is widely used in various fields, including finance, economics, marketing, and healthcare.
Types of Regression Analysis
Regression analysis comes in different forms, but two of the most commonly used types are linear regression and multiple regression.
Linear regression is a fundamental statistical method that models the relationship between a dependent variable and one or more independent variables using a straight line. The goal is to find the best-fitting line through the data points, which can then be used to predict values of the dependent variable based on the independent variable(s).
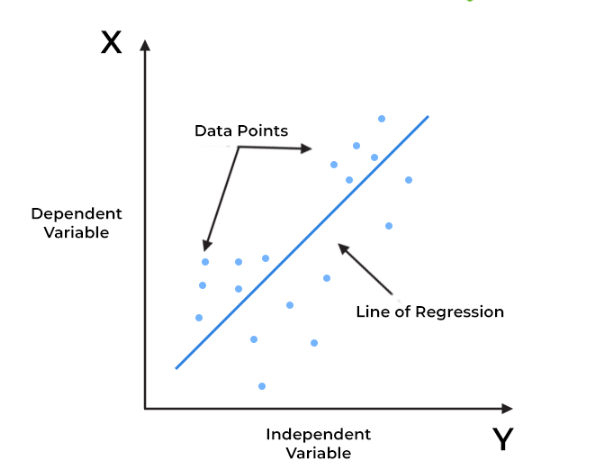
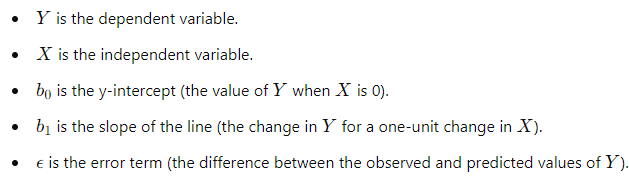
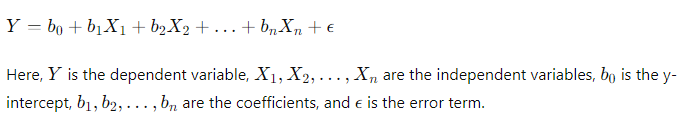
In linear regression, the relationship is represented by the equation of a straight line:
![]()
Here:
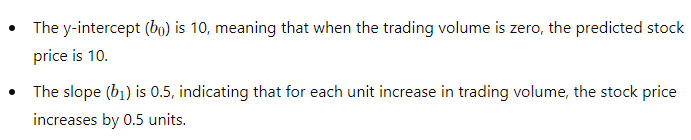
Consider a simple example in stock trading. Suppose we want to analyze the relationship between a stock's price and its trading volume. The linear regression model might look like this:
Stock Price=10+0.5(Volume)+𝜖
In this equation:
Linear regression is widely used because it is simple and interpretable. It allows traders to understand the relationship between variables and make informed predictions. For example, understanding how trading volume affects stock price can help traders make better decisions about when to buy or sell stocks.
For linear regression to provide reliable results, several assumptions must be met:
At Stocksphi, we emphasize the importance of validating these assumptions to ensure the accuracy and reliability of regression analysis results. Our expertise in regression analysis enables us to address these assumptions effectively, providing accurate insights for traders and investors.
Multiple regression is an extension of simple linear regression. It is used when there are two or more independent variables that affect a single dependent variable. This technique allows for a more comprehensive analysis by considering the combined influence of multiple factors.
In multiple regression, the equation takes the form:
Imagine you are analyzing the factors influencing a stock's price. Apart from just the volume of trades (as in simple linear regression), you might also consider the company's earnings, market sentiment, and macroeconomic indicators. A multiple regression model could help quantify how these variables collectively impact the stock price.
For instance: Stock Price= 50+2.3(Volume)+5.1(Earnings)+3.2(Market Sentiment)+0.8(GDP Growth)+𝜖
This equation suggests that each unit increase in volume, earnings, market sentiment, and GDP growth has a specific impact on the stock price.
Like linear regression, multiple regression also relies on several key assumptions. These include:
3. Assumptions of Regression Analysis
Regression analysis, whether linear or multiple, relies on several key assumptions to ensure the validity of its results. These assumptions include:
4. How Regression Analysis is Used in Trading
Regression analysis plays a vital role in trading and investment strategies. Here are several ways it is applied:
At Stocksphi, we leverage regression analysis to develop robust trading strategies and provide our clients with accurate forecasts and actionable insights.
Regression analysis has numerous practical applications across different domains. Here are some real-world examples:
For traders and investors, regression analysis is invaluable in predicting stock prices, evaluating market trends, and optimizing trading strategies. Stocksphi leverages advanced regression techniques to provide actionable insights and improve trading outcomes.
Despite its advantages, regression analysis comes with challenges:
Stocksphi addresses these challenges through meticulous data processing, model validation, and expert analysis, ensuring robust and reliable regression models.
In this article, we've explored the fundamentals of regression analysis, focusing on linear and multiple regression, their assumptions, practical applications, benefits, and challenges. Understanding regression analysis is crucial for making informed decisions in various domains, particularly in trading and finance.
At Stocksphi, we harness the power of regression analysis to provide traders with the insights they need to navigate the financial markets effectively. By applying these techniques, you can enhance your trading strategies and achieve better outcomes.
Start integrating regression analysis into your trading decisions today with Stocksphi's expert guidance and services. Visit Stocksphi to learn more and take your trading to the next level.